Database
2/3/2023
InfluxDB / Telegraf
使用时序数据库存储时间序列数据
InfluxDB
InfluxDB 是一个开源的时序数据库,专门用于存储和查询时间序列数据。它提供了一种高效的方式来存储时间相关的数据,并通过使用简单的语言
InfluxQL/Flux 来进行查询和分析。InfluxDB 特别适用于处理 IoT
中的海量数据,例如传感器数据,应用程序性能数据等。它具有高度可扩展性、快速读写性能和可靠性等特点,是用于大规模时序数据处理的理想选择。
Install
$ docker pull influxdb # 这里安装的是 v2.6Configuration
为了方便使用,我们使用数据卷映射容器内的配置文件
- 首先我们创建一个新的目录
$ mkdir config | cd $_

$ docker run \
  --name influxdb \
  -p 8086:8086 \
  -v $PWD:/var/lib/influxdb2 \
influxdb- 执行以下命令获取默认的配置文件
# 获取默认的配置文件 `config.yml`
$ docker run --rm influxdb \
  influxd print-config > config.yml
Start
重新启动容器
$ docker run -p 8086:8086 \
  --name influxdb \
  -v $PWD/config.yml:/etc/influxdb2/config.yml \
  influxdb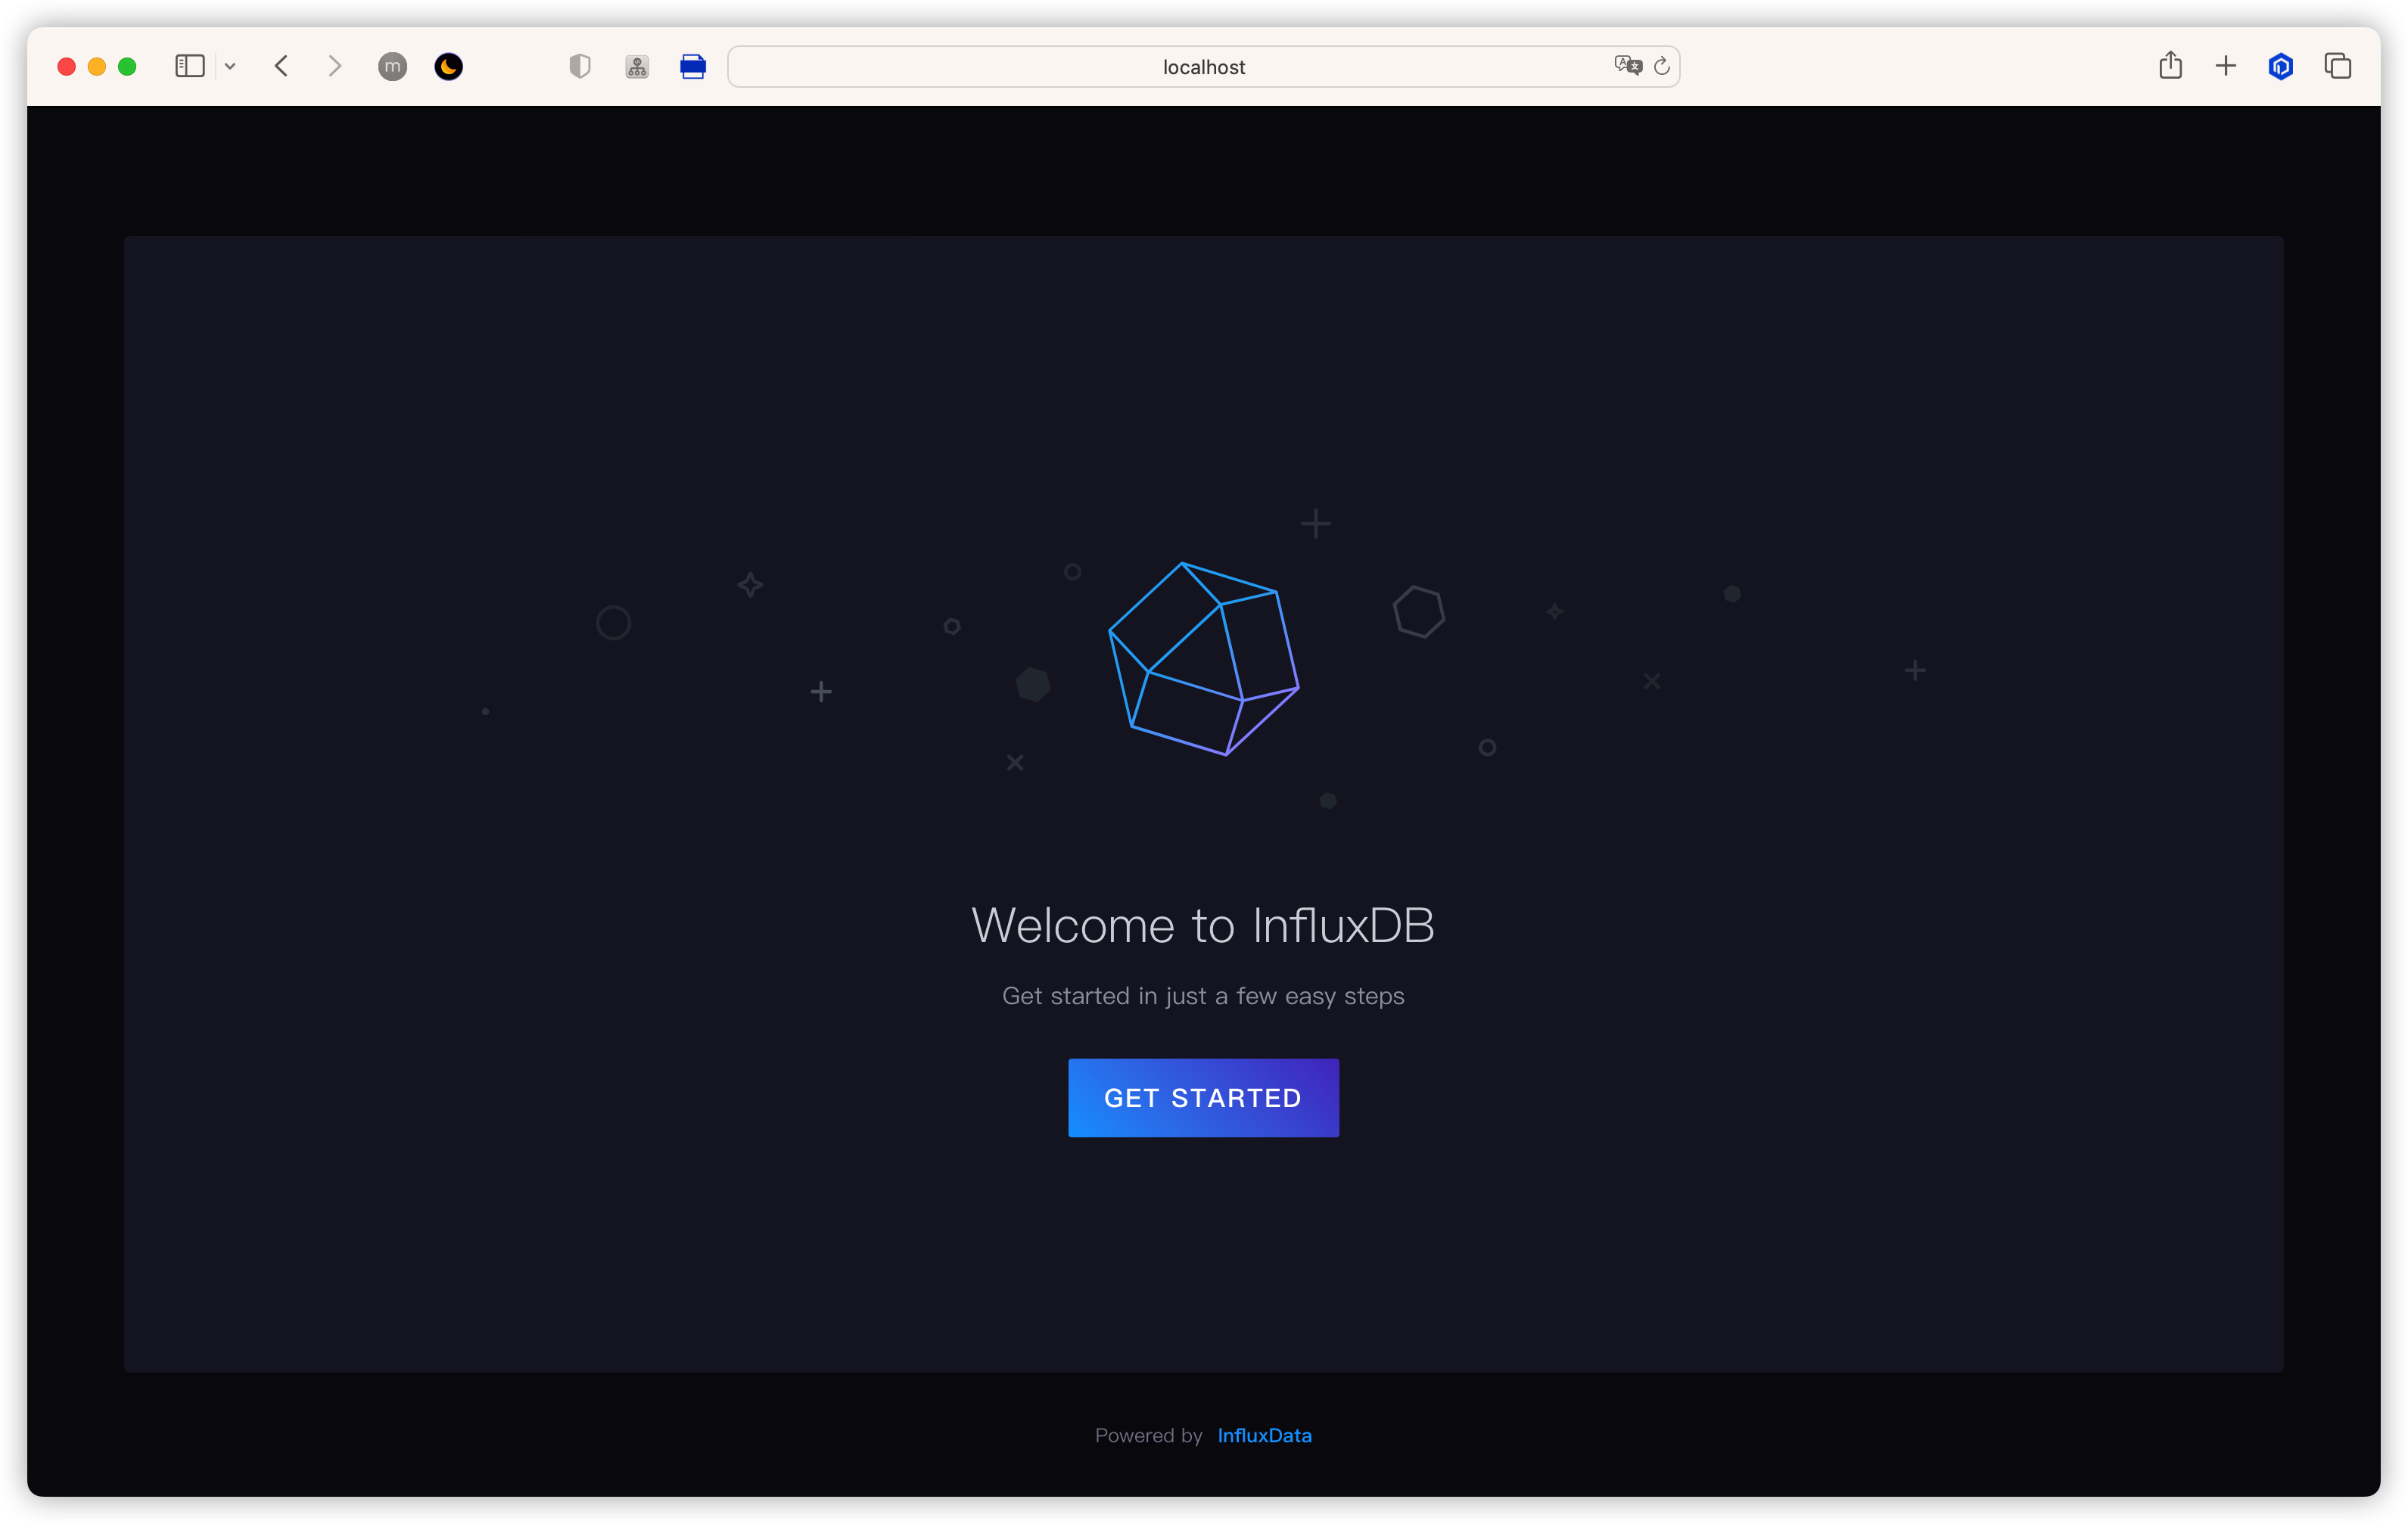
Get Started
完成注册
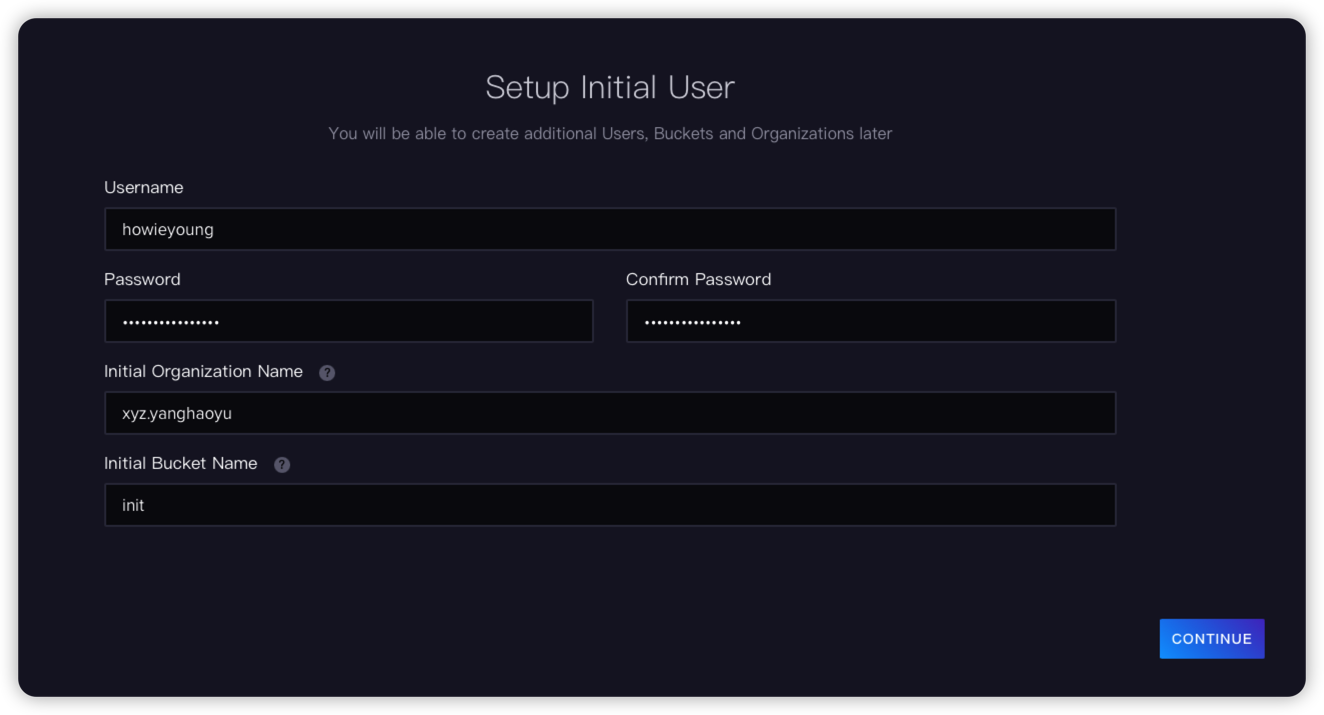
Register
使用 Telegraf 收集数据
Telegraf 是一个插件驱动的服务器代理,用于从数据库、系统和 IoT 传感器收集和发送指标和事件。
它由 Go 编写而成,可以编译成一个没有外部依赖关系的二进制文件,并且只需要非常小的内存占用。
Install
$ docker pull telegrafConfiguration
Telegraf 拉下来之后是不能直接使用的,我们先在 InfluxDB 的前端中把 Telegraf 的默认配置获取到,然后映射到 Telegraf 容器中
Generate Default Config
通过 telegraf 获取系统数据,并发送到 InfluxDB
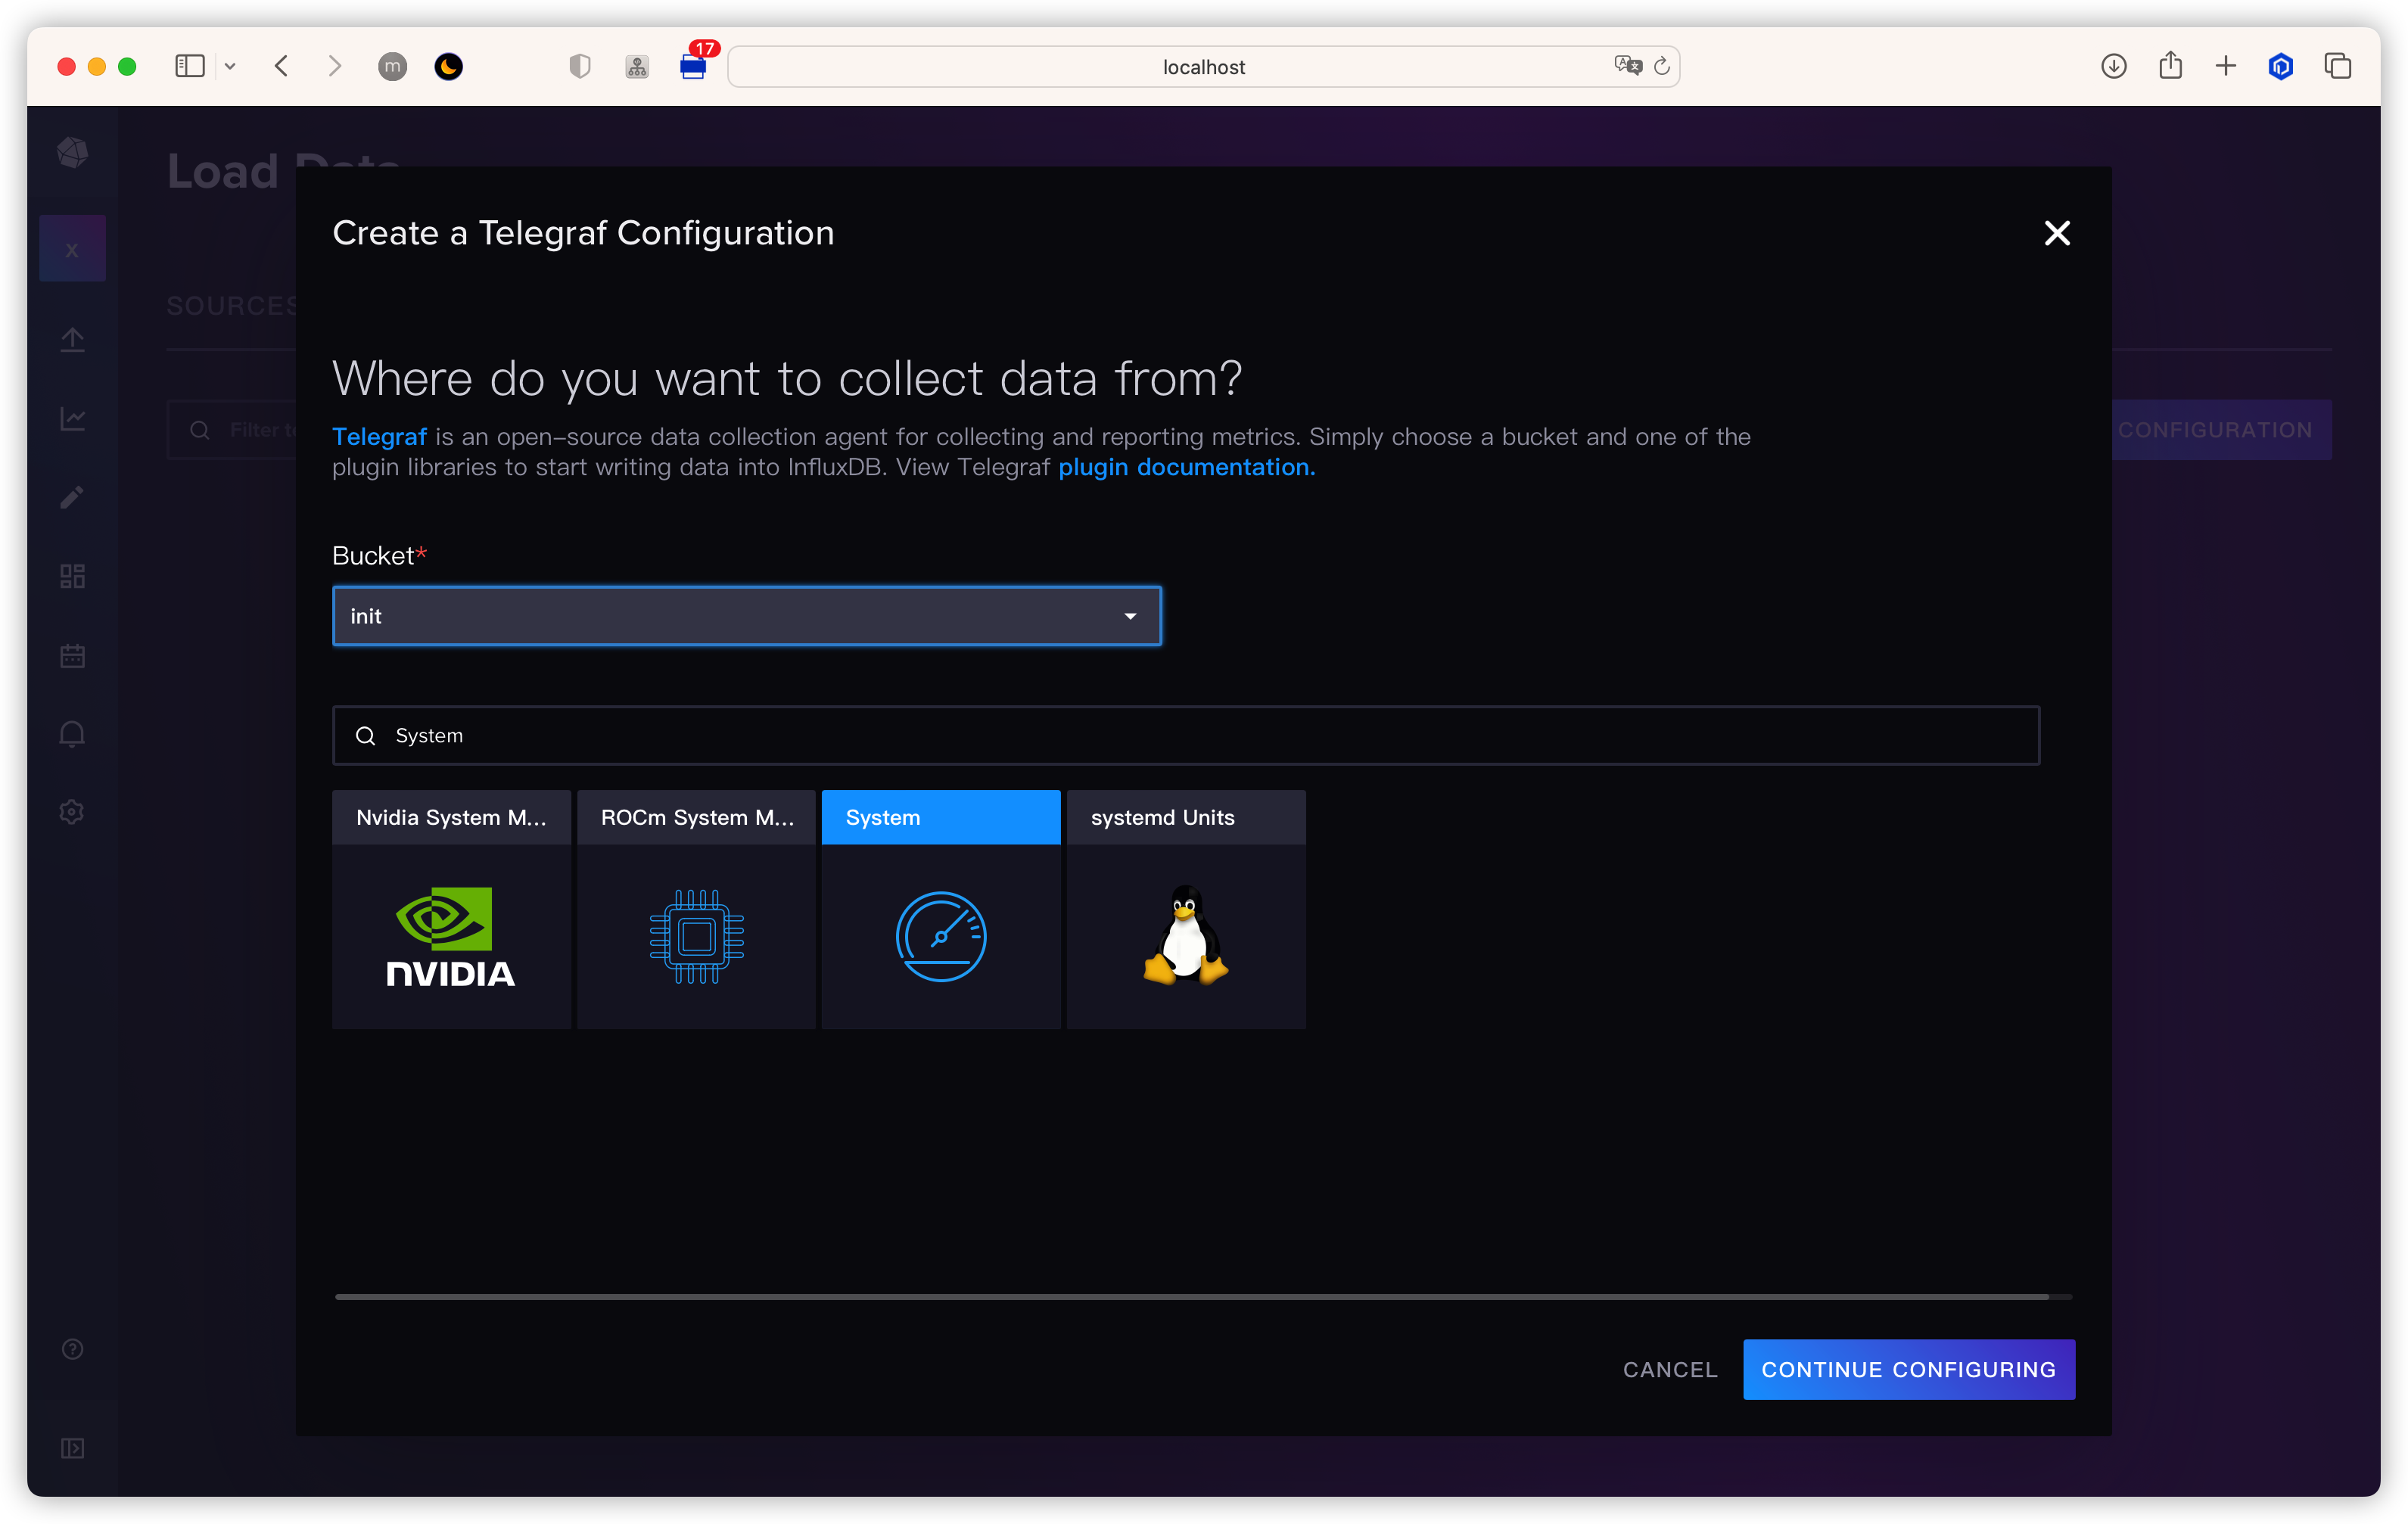
Select Configuration
把该文件保存到本地 ~/.telegraf/telegraf.conf
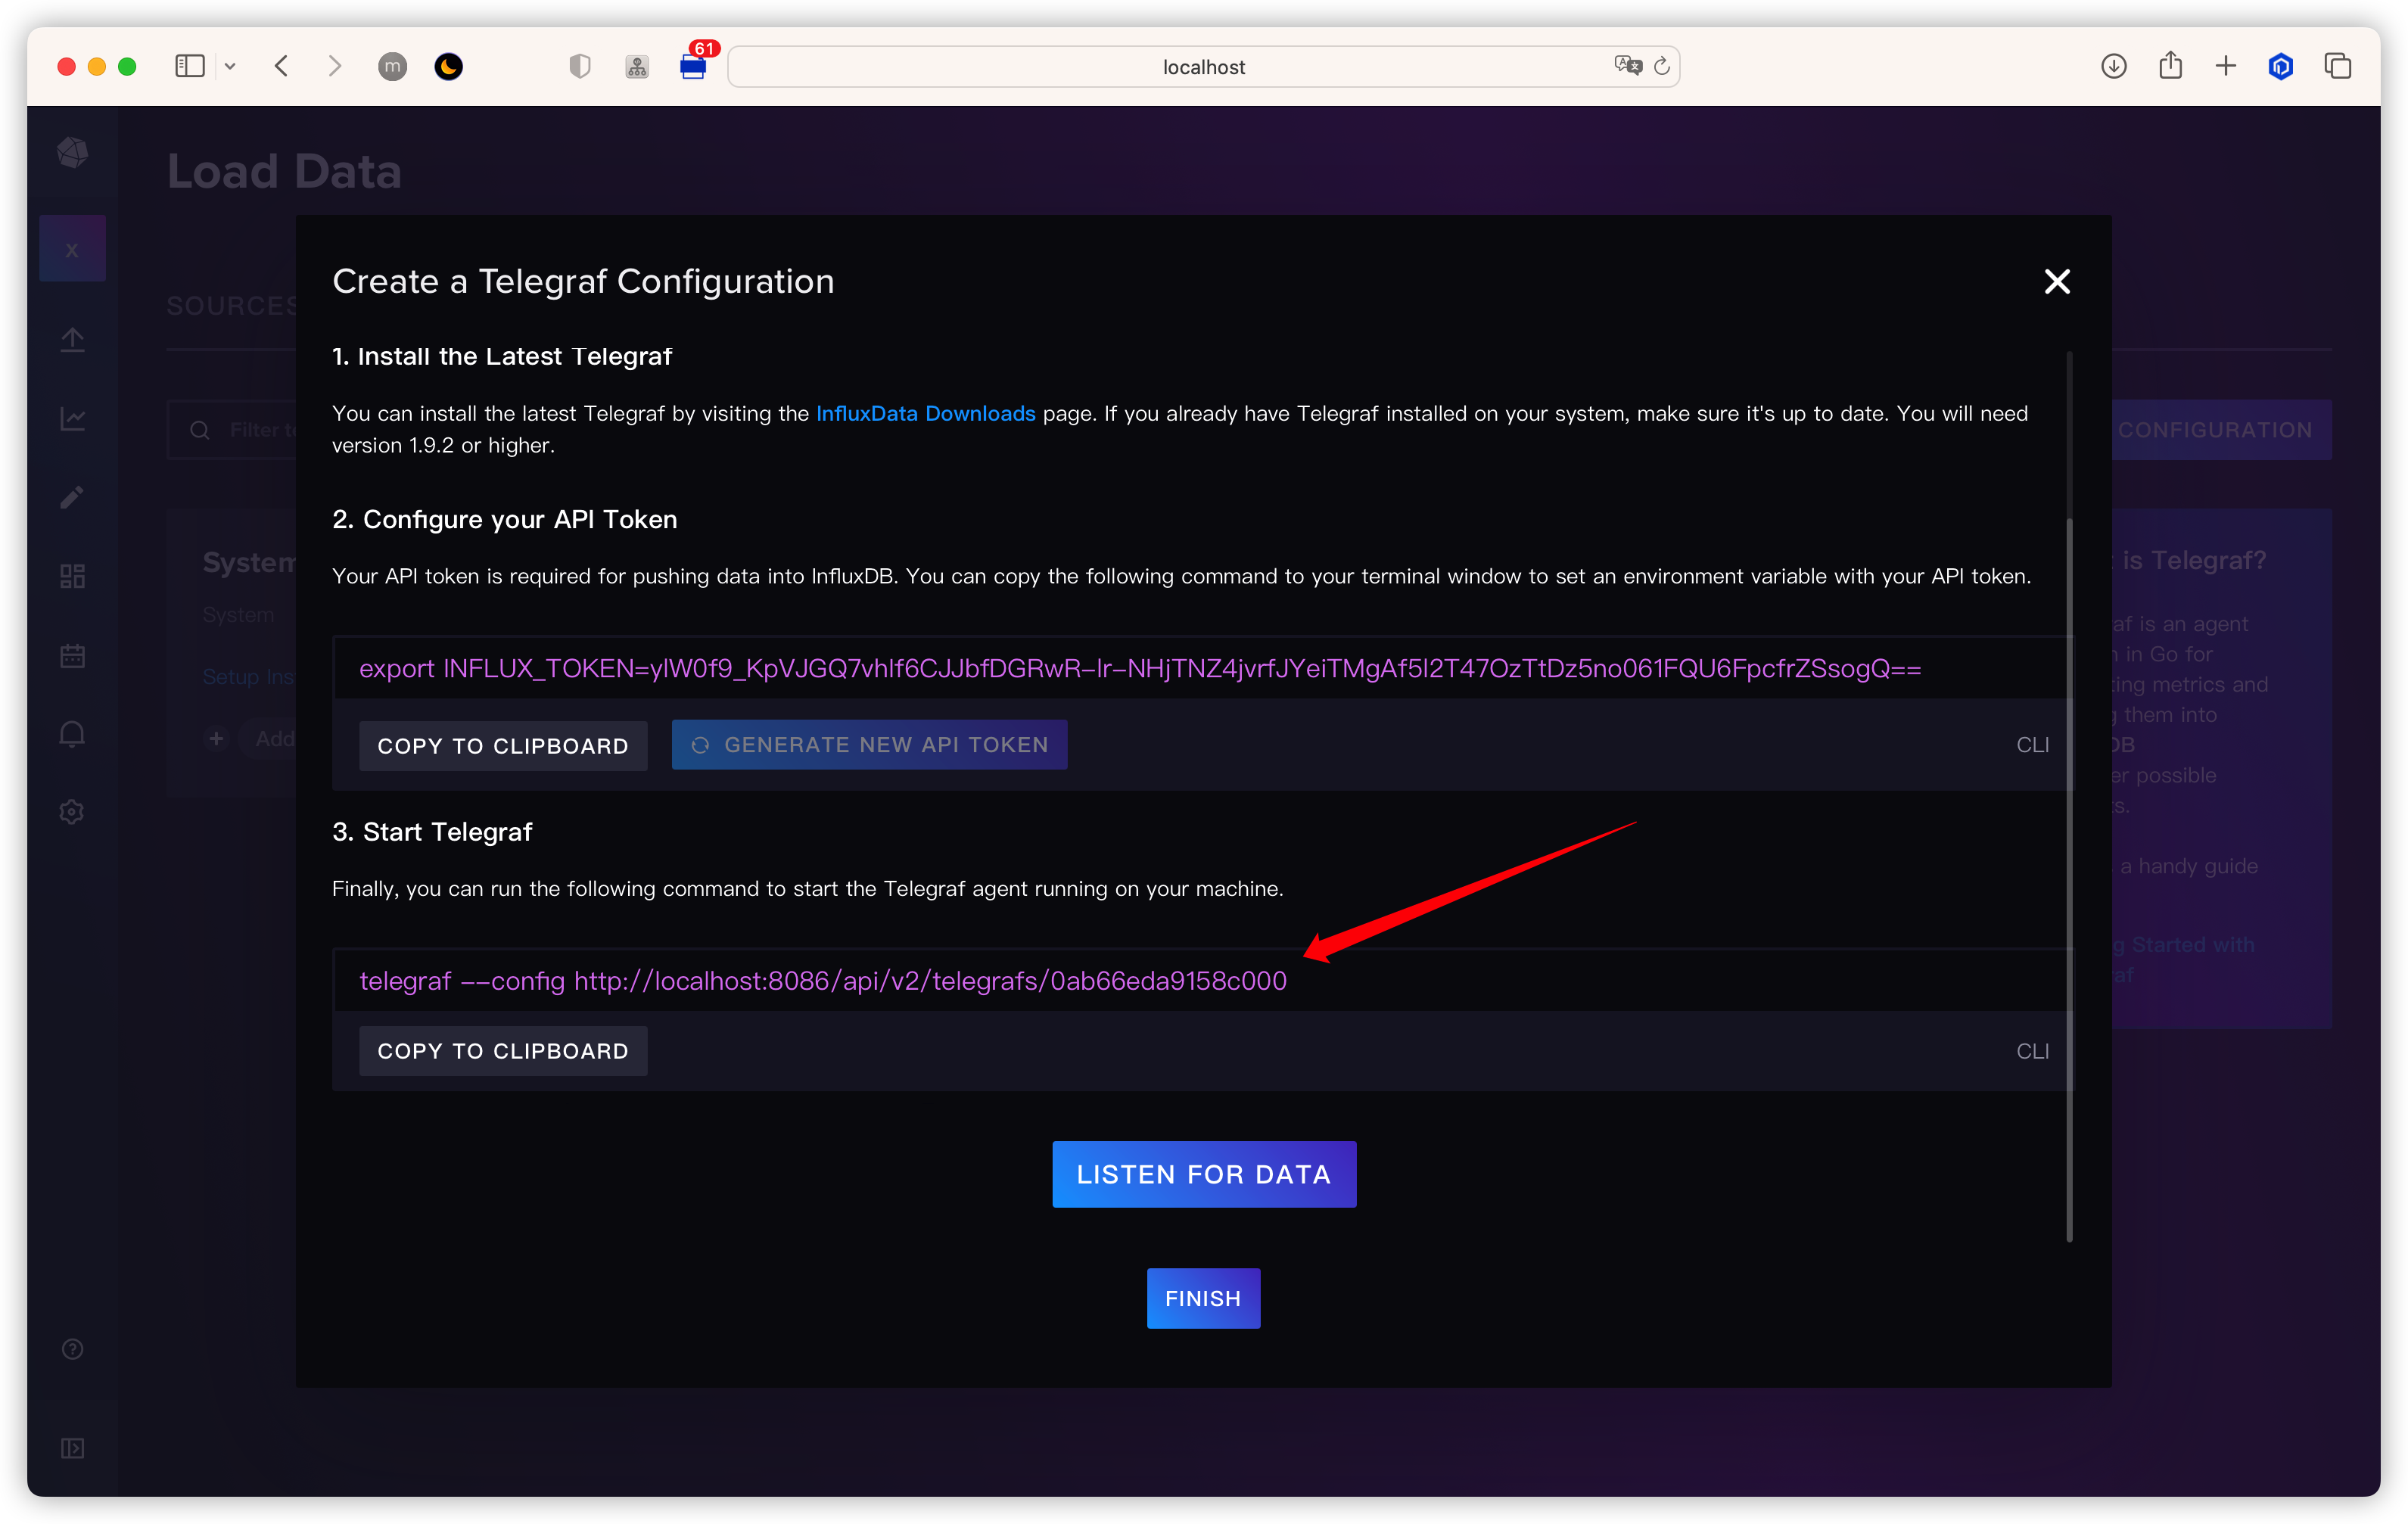
Create Configuration
Customize Config
打开文件,以下是一些重要配置
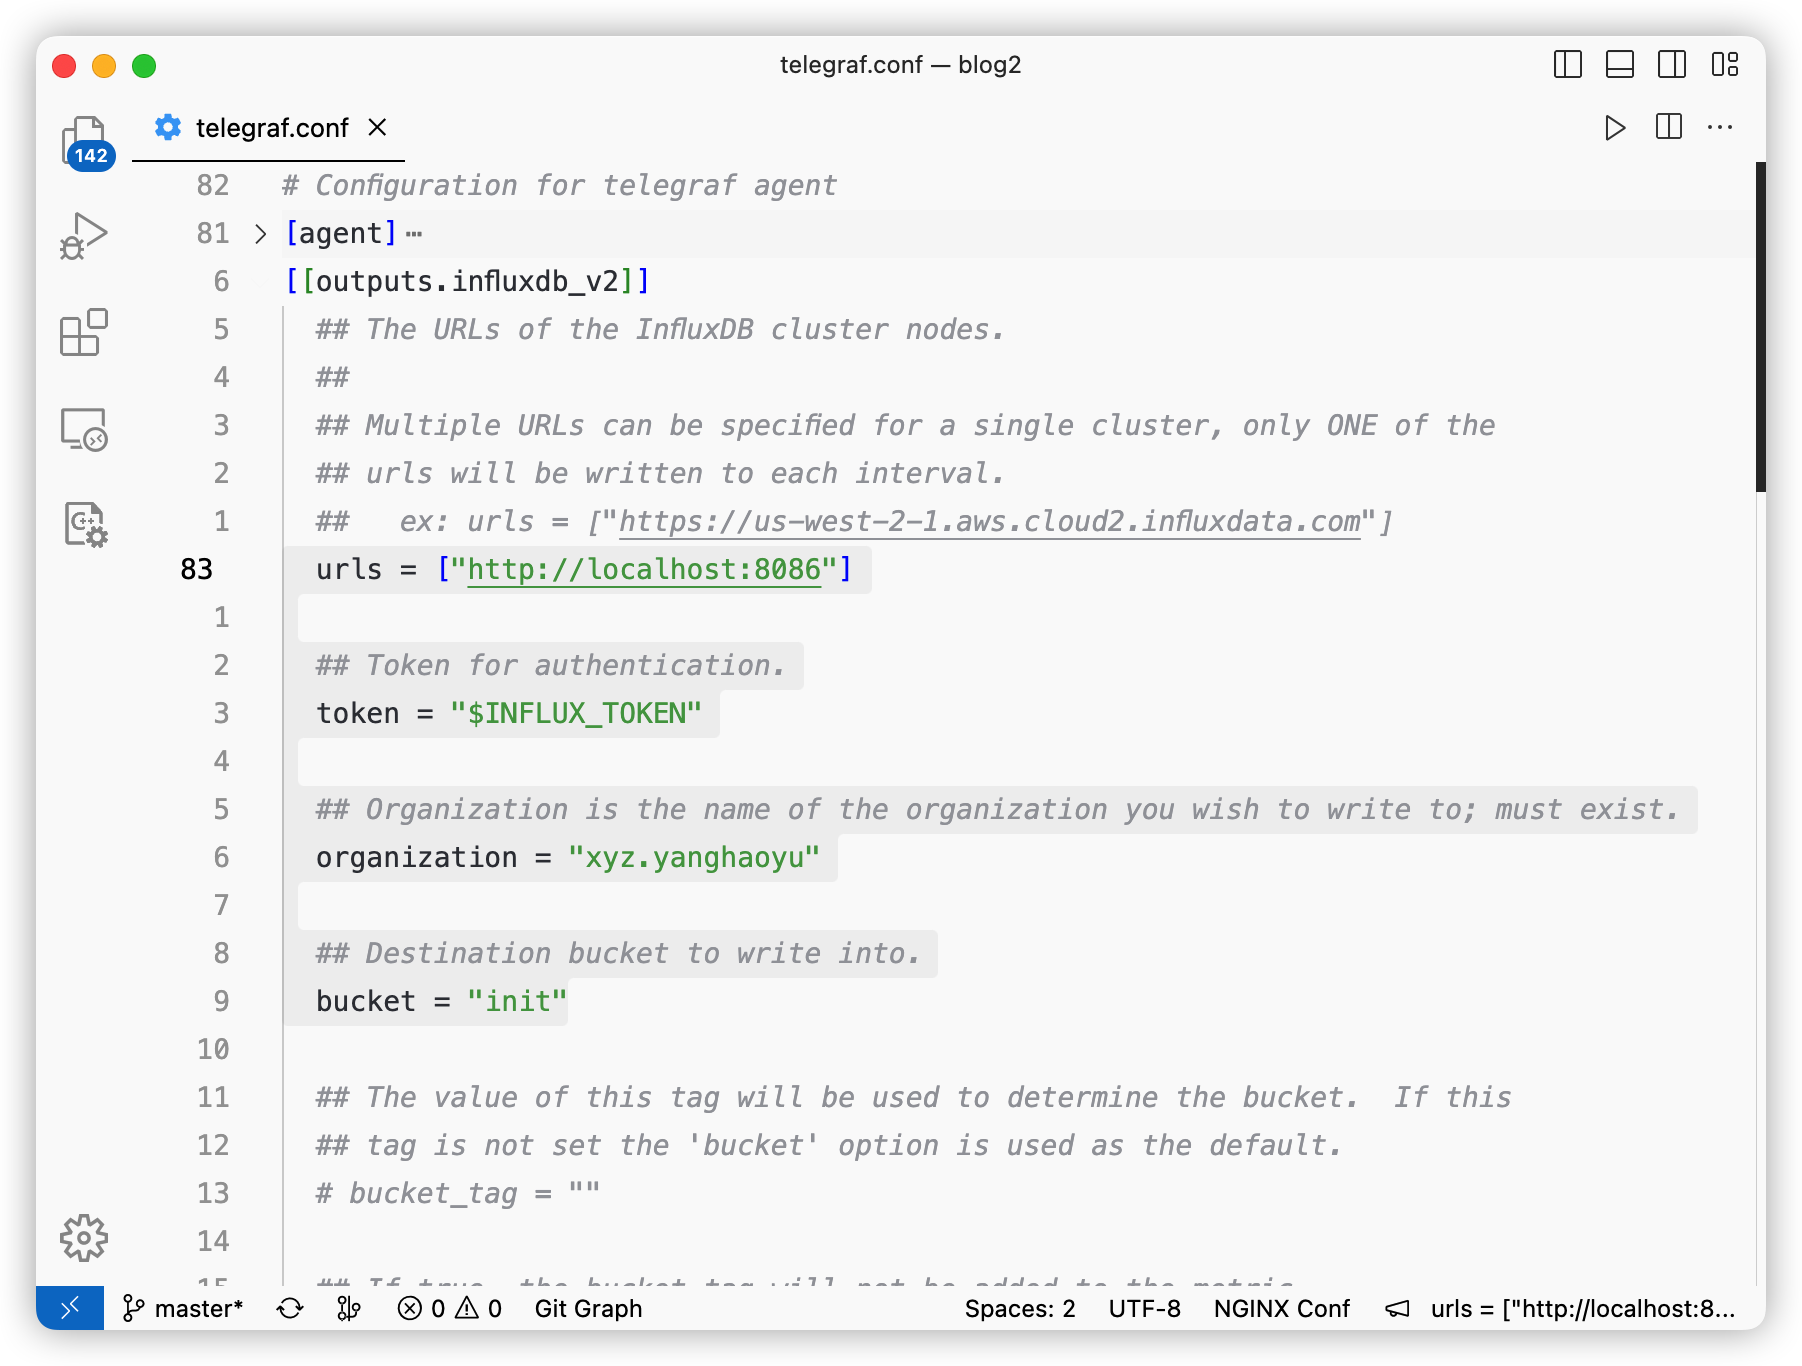
Important Items
把 url 改为宿主机地址
同时把前端的 Token 拷贝过来
# 改为宿主机地址
urls = ["http://192.168.100.178:8086"]
# Token 从前端 copy 过来
token = "Eyfg5tBzDtuXMOMTvJMXq6BfFW7nkGlWA-f87nQL2IBfbAjDFKEE-4UK3RgReNowaHK3OaLde68_77DgLPCKQg=="
organization = "xyz.yanghaoyu"
bucket = "init"
Start
把配置映射到 Telegraf 容器中并启动
$ docker run -d \
  --name telegraf \
  -v ~/.telegraf/telegraf-docker.conf:/etc/telegraf/telegraf.conf \
  telegraf
查看日志
$ docker logs -f telegraf
2023-02-07T04:07:07Z I! Using config file: /etc/telegraf/telegraf.conf
2023-02-07T04:07:07Z I! Using config file: /etc/telegraf/telegraf.conf
2023-02-07T04:07:07Z I! Starting Telegraf 1.25.1
2023-02-07T04:07:07Z I! Available plugins: 227 inputs, 9 aggregators, 26 processors, 21 parsers, 57 outputs, 2 secret-stores
2023-02-07T04:07:07Z I! Loaded inputs: system
2023-02-07T04:07:07Z I! Loaded aggregators:
2023-02-07T04:07:07Z I! Loaded processors:
2023-02-07T04:07:07Z I! Loaded secretstores:
2023-02-07T04:07:07Z I! Loaded outputs: influxdb_v2
2023-02-07T04:07:07Z I! Tags enabled: host=f756e8f61c6e
2023-02-07T04:07:07Z I! [agent] Config: Interval:10s, Quiet:false, Hostname:"f756e8f61c6e", Flush Interval:10s
可以看到 Telegraf 已经成功启动
获取数据
Line Protocol
Document: https://docs.influxdata.com/influxdb/v2.6/reference/syntax/line-protocol/
在 InfluxDB 中所有数据都是通过
line protocol 写入的,具体结构如下: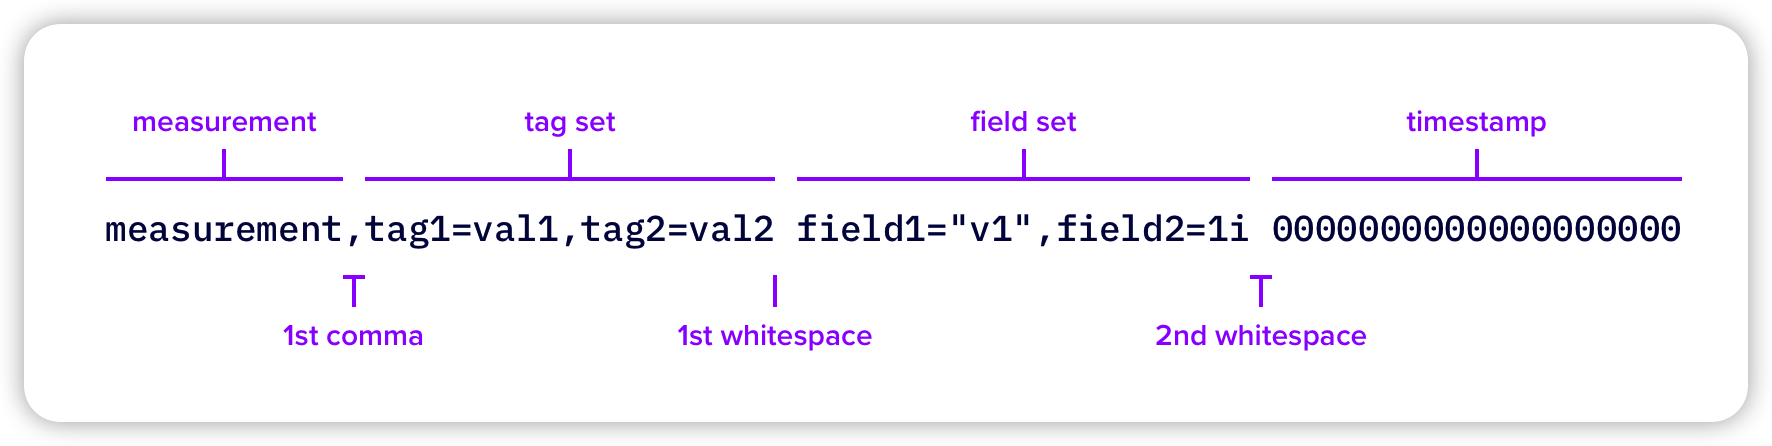
Line Protocol
它主要包含以下四个字段
| 名称 | 类型 | 描述 | 必需? |
|---|---|---|---|
| measurement | String | measurement 相当于你要测量的东西的集合,例如你想要记录温度,那么创建一个名为 Temperature 的 measurement | required |
| field set | key: String, value: Float | Integer | UInteger | String | Boolean | field 存储在 measurement 中,用于说明具体的测量值,例如在 Temperature 的 measurement 中存储 value:14 这个键值对表示温度为 14 度 | required |
| tag set | key: String, value: String | tags 用于存储一些元数据,在 Temperature 中存储 location:Chengdu,那么配合 value:14 就可以表示成都的温度是 14 度 | optional |
| timestamp | Unix timestamp | 测量时的时间戳,表示数据是何时测量的 | required |
InfluxCLI
InfluxCLI 是 InfluxDB 的客户端,可以用来管理 buckets, organizations, users, tasks 等等数据
Document: https://docs.influxdata.com/influxdb/v2.1/reference/cli/influx/
Configure Token
在初次使用时需要配置用户的 Token 用于登录
执行
influx config create 生成默认配置文件--active: 把生成的配置作为当前正在使用的用户配置(InfluxCLI 允许配置多个用户,需要指定一个为活跃用户)-n: 配置文件的名称,可以随便取-u: InfluxDB 的地址,localhost:8086-t: 用户的 Token,在 InfluxDB 前端中获取-o: 组织名
$ influx config create --active \
-n howieyoung-docker \
-u http://localhost:8086 \
-t Eyfg5tBzDtuXMOMTvJMXq6BfFW7nkGlWA-f87nQL2IBfbAjDFKEE-4UK3RgReNowaHK3OaLde68_77DgLPCKQg== \
-o xyz.yanghaoyu
# influx config create --active \
# -n <config-name> \
# -u <influxdb-server-address> \
# -t <token> \
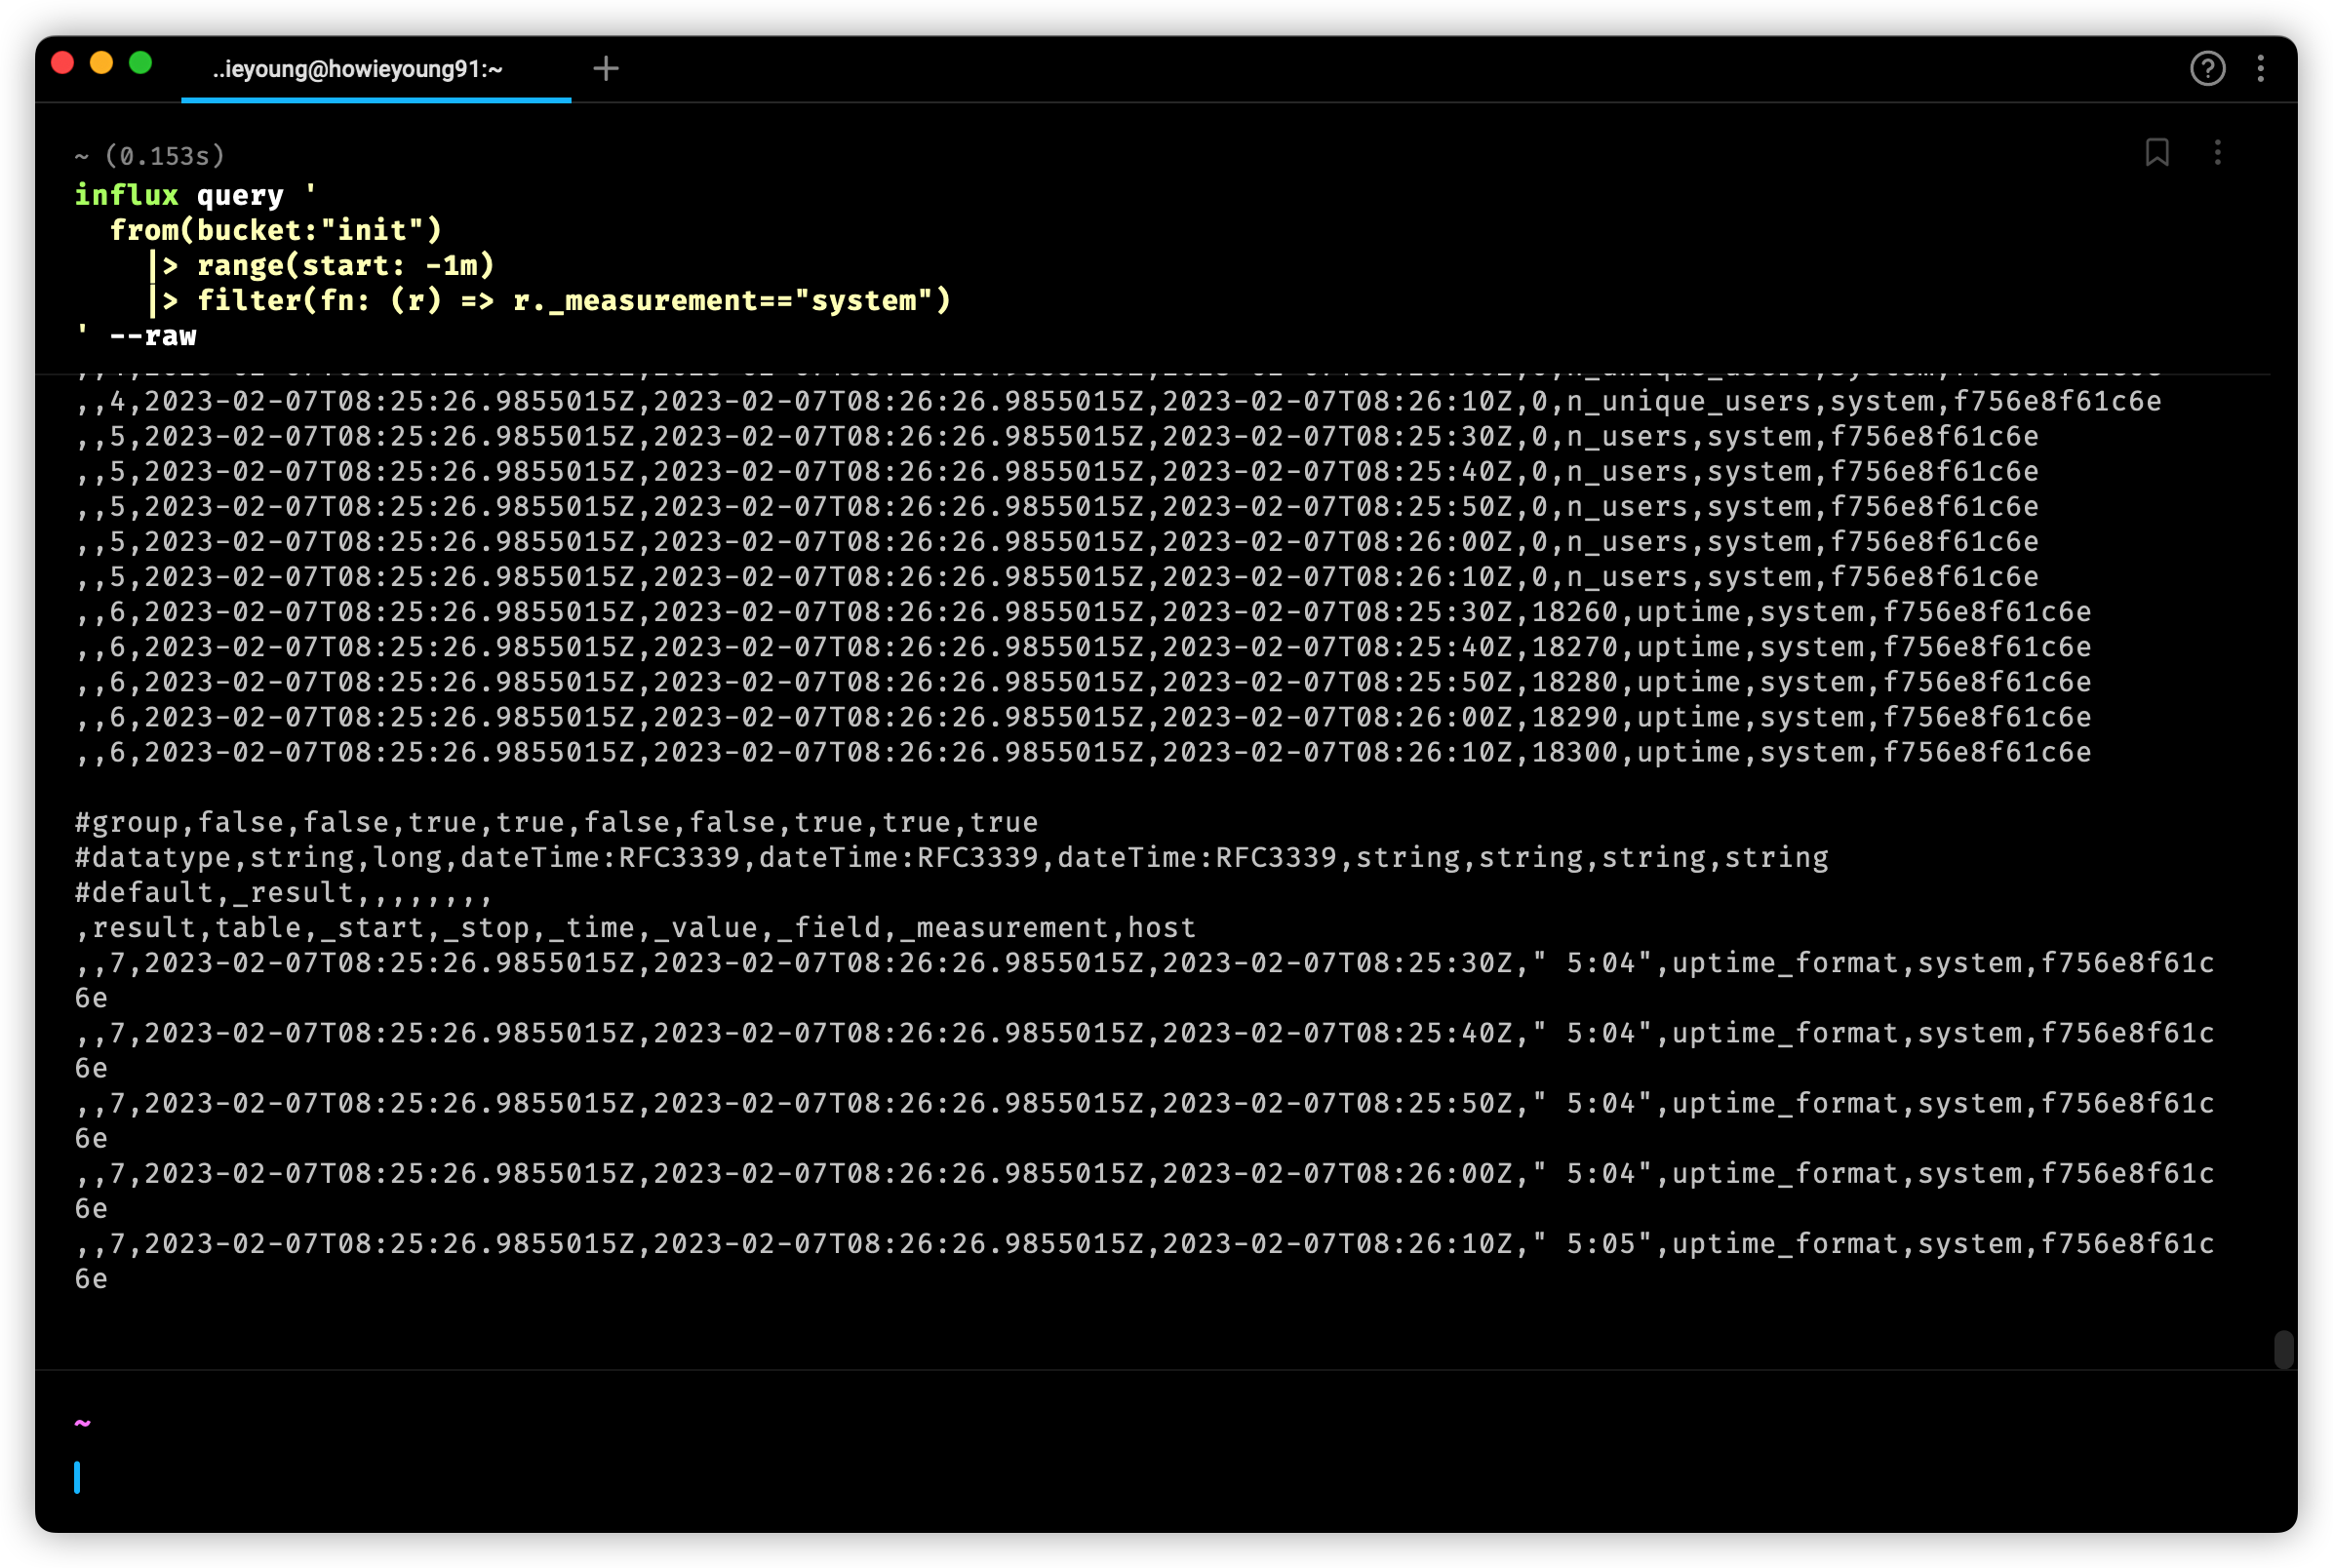
# -o <organization>Query Data Using Flux
输入一下命令,获取 Telegraf 收集到的数据
$ influx query '
    from(bucket:"init")
      |> range(start: -1m)
      |> filter(fn: (r) => r._measurement=="system")
  ' --raw
可以看到,已经成功获取!
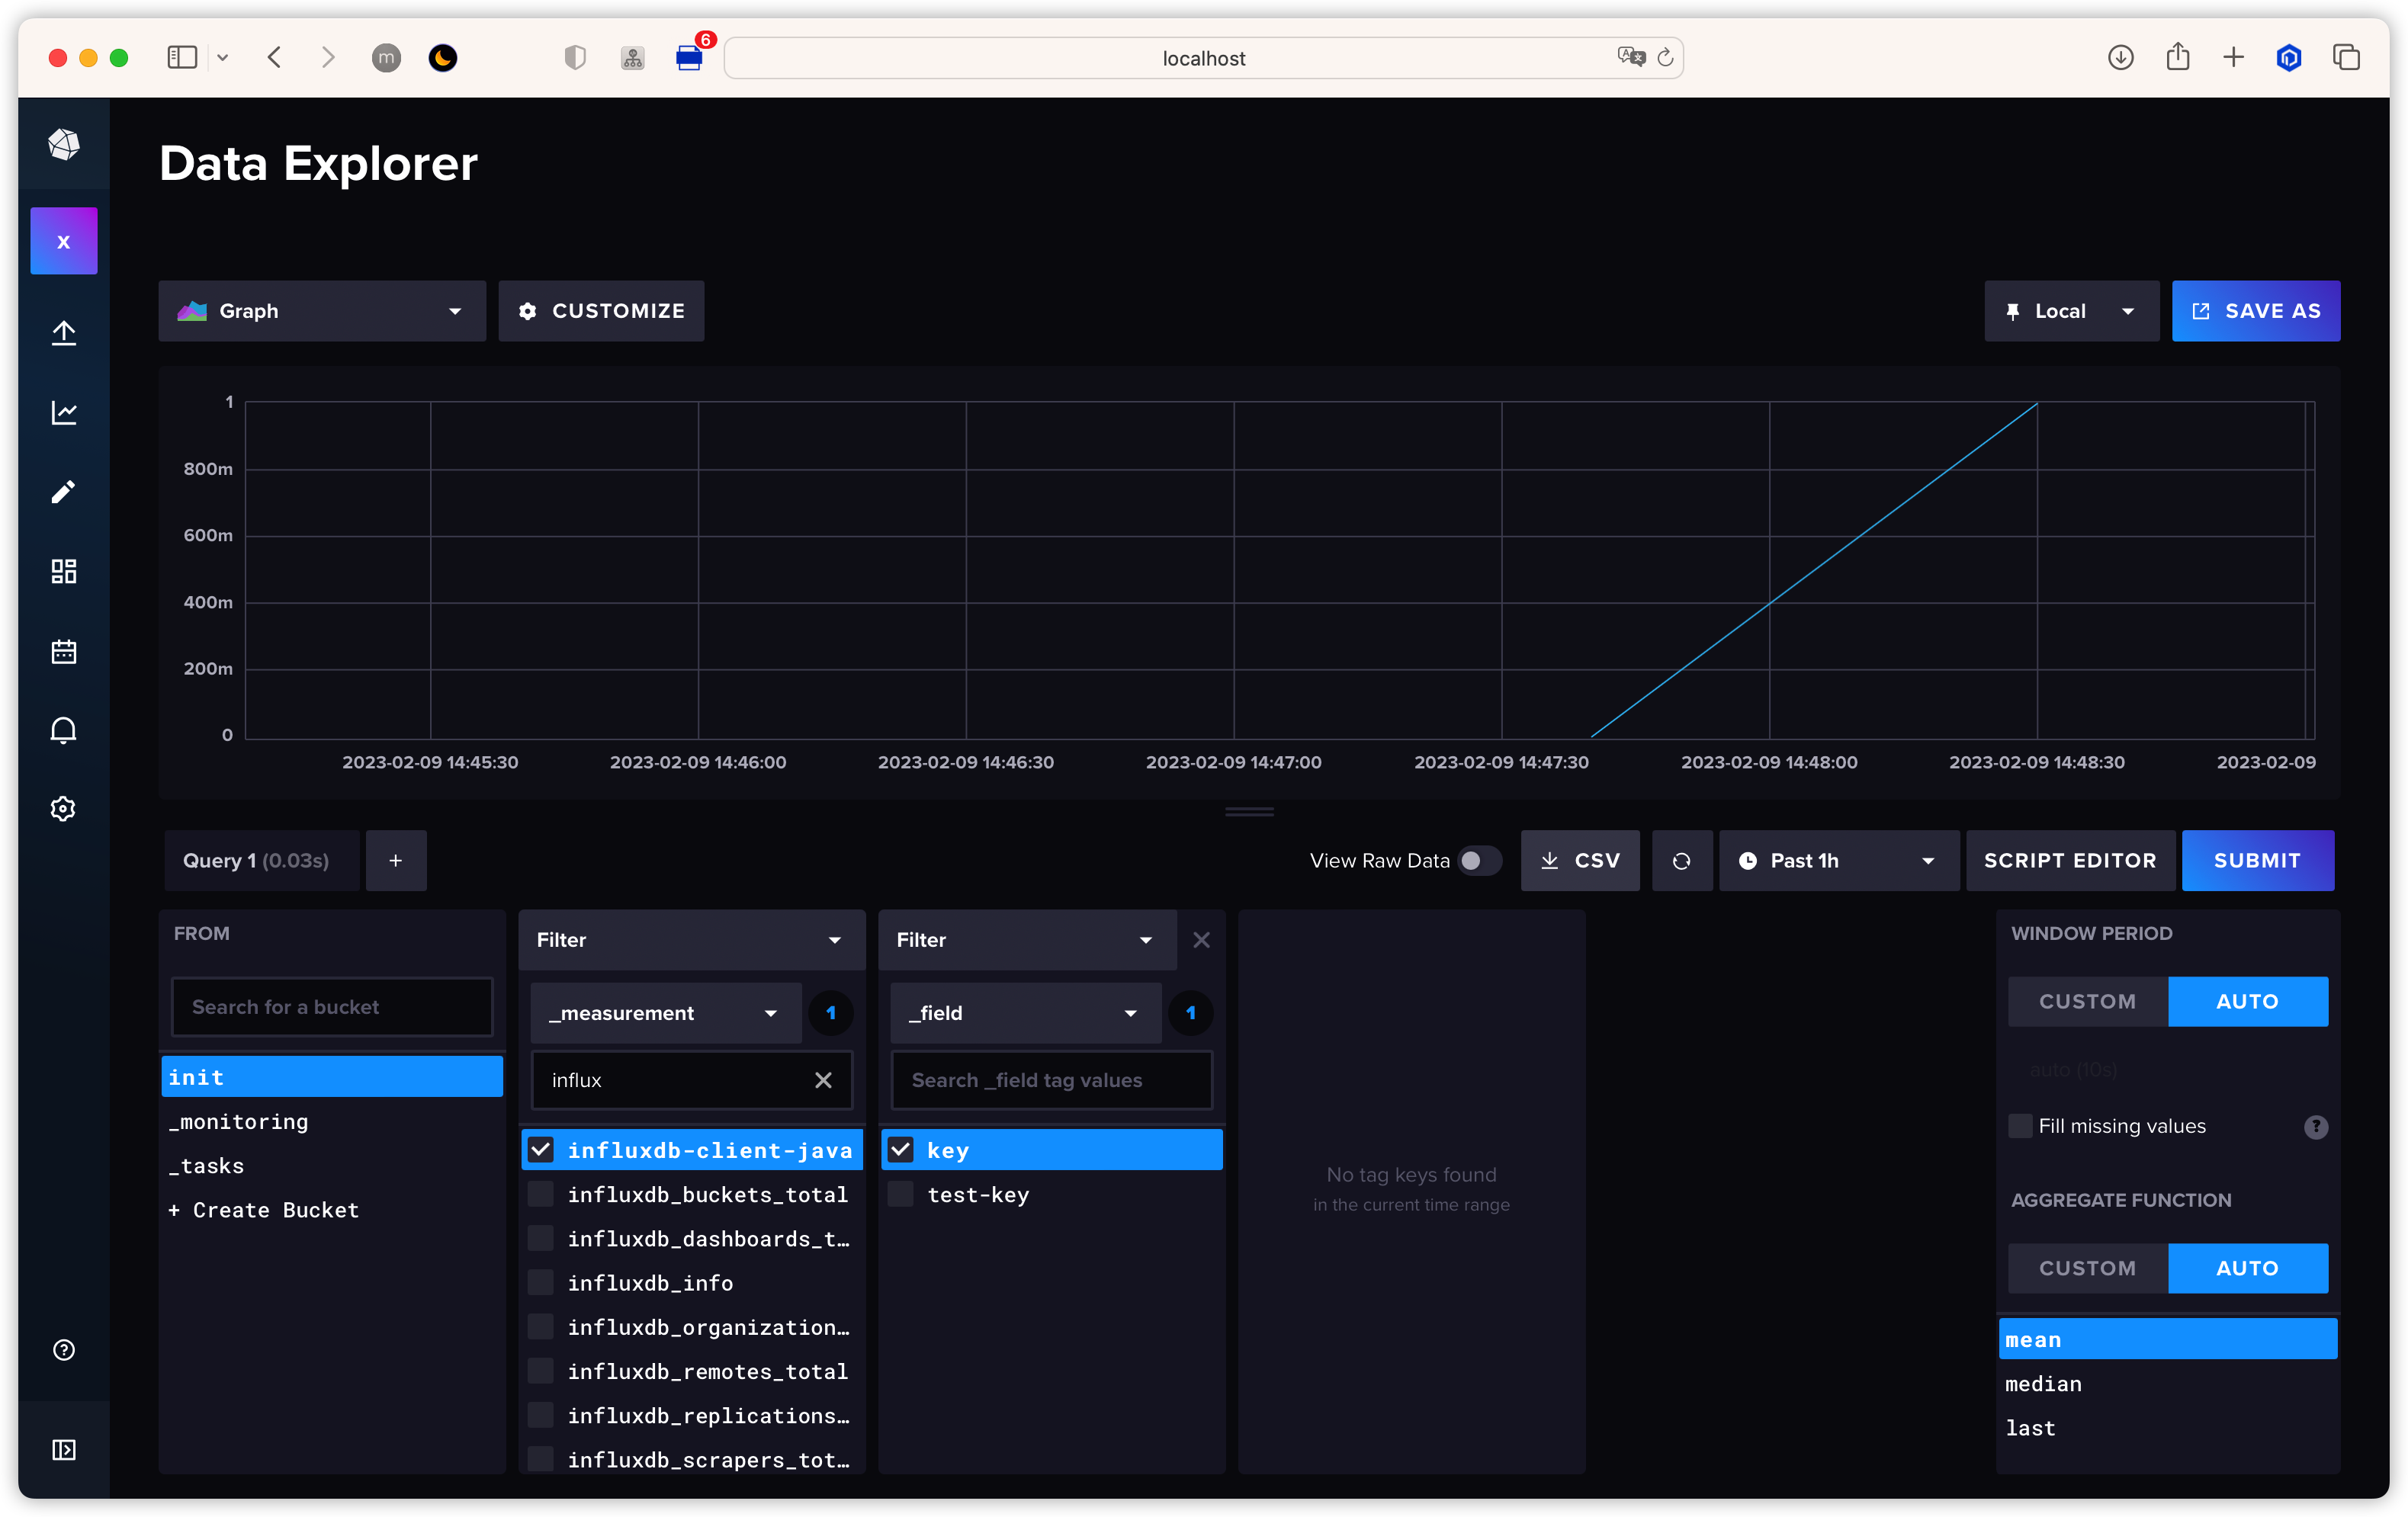
Query
Java
pom
<dependency>
    <groupId>com.influxdb</groupId>
    <artifactId>influxdb-client-java</artifactId>
    <version>6.3.0</version>
</dependency>

<dependency>
    <groupId>com.influxdb</groupId>
    <artifactId>flux-dsl</artifactId>
    <version>6.7.0</version>
</dependency>

<dependency>
    <groupId>org.jetbrains.kotlin</groupId>
    <artifactId>kotlin-stdlib</artifactId>
    <version>1.7.10</version>
</dependency>
demo
- 在
application.yaml中写入配置信息
spring:
  influx:
    url: http://localhost:8086
    token: ${your token}
    org: ${your organization}
bucket: ${your bucket}- 编写配置类
InfluxConfig
我们先创建
InfluxDBClient,可以手动配置一些参数。
所有关于写数据的操作被封装在 WriteApi 中,
我们可以使用 makeWriteApi 获取到 WriteApi,
这个方法会创建一个异步非阻塞的客户端,后台会有一个线程把数据写入 InfluxDB,所以 WriteApi 应该使用单例@SpringBootApplication
public class App {
public static void main(String[] args) {
SpringApplication.run(App.class, args);
}
@Configuration
public static class InfluxConfig {
@Value("${spring.influx.url}")
private String url;
@Value("${spring.influx.token}")
private String token;
@Value("${spring.influx.org}")
private String org;
// batchSize the number of data point to collect in batch
//
// flushInterval the number of milliseconds before the batch is written
//
// jitterInterval the number of milliseconds to increase the batch flush interval
// by a random amount
//
// retryInterval the number of milliseconds to retry unsuccessful write.
// The retry interval is used when the InfluxDB server does
// not specify "Retry-After" header.
//
// maxRetries the number of max retries when write fails
//
// maxRetryDelay the maximum delay between each retry attempt in milliseconds
//
// maxRetryTime maximum total retry timeout in milliseconds
//
// exponentialBase the base for the exponential retry delay, the next delay is
// computed using random exponential backoff as a random value
// within the interval `retryInterval * exponentialBase^(attempts-1)`
// and `retryInterval * exponentialBase^(attempts)`. Example for
// `retryInterval=5_000, exponentialBase=2, maxRetryDelay=125_000, total=5`
// Retry delays are random distributed values within the ranges of
// `[5_000-10_000, 10_000-20_000, 20_000-40_000, 40_000-80_000, 80_000-125_000]`
//
// bufferLimit the maximum number of unwritten stored points
//
// backpressureStrategy the strategy to deal with buffer overflow
public OkHttpClient.Builder okHttpClientBuilder() {
return new OkHttpClient.Builder()
.connectionPool(new ConnectionPool(20, 10, TimeUnit.MINUTES))
.addInterceptor(chain -> {
Request request = chain.request();
// do something...
Response response = chain.proceed(request);
// do something...
return response;
});
}
@Bean
public InfluxDBClient influxDBClient() {
return InfluxDBClientFactory.create(
InfluxDBClientOptions.builder()
.logLevel(LogLevel.BODY)
.bucket(url)
.authenticateToken(token.toCharArray())
.org(org)
.okHttpClient(okHttpClientBuilder())
.build()
);
}
@Bean
public WriteApi asyncWriteApi() {
return influxDBClient().makeWriteApi(WriteOptions.builder()
.flushInterval(1000)
.bufferLimit(10000)
.retryInterval(5000)
.maxRetries(5)
.build()
);
}
@Bean
public WriteApiBlocking syncWriteApi() {
return influxDBClient().getWriteApiBlocking();
}
@Bean
public QueryApi queryApi() {
return influxDBClient().getQueryApi();
}
}
}- 编写业务
InfluxService
@Service
public class InfluxService {
    @Resource
    private QueryApi queryApi;
    @Resource
    private WriteApi writeApi;
    @Value("${spring.influx.org}")
    private String   organization;

    public void insert(String measurement, String field, int value, String bucket) {
        Point point = Point.measurement(measurement)
                           .addField(field, value)
                           .time(Instant.now(), WritePrecision.NS);

        writeApi.writePoint(bucket, organization, point);
    }

    public void queryByFluxString(String bucket, String measurement, String field, int limit) {
        String fluxString = "from(bucket: \"" + bucket + "\")" +
                "|> range(start: 0)" +
                "|> filter(fn: (r) => r._measurement == \"" + measurement + "\")" +
                "|> filter(fn: (r) => r[\"_field\"] == \"" + field + "\")" +
                "|> limit(n:" + limit + ")";

        // sync call
        List<FluxTable> tables = queryApi.query(fluxString);
        for (FluxTable table : tables) {
            for (FluxRecord record : table.getRecords()) {
                System.out.println(record.getValue());
            }
        }
    }

    public void queryByFlux(String bucket, String measurement, String field, int limit) {
        Flux flux = Flux.from(bucket)
                        .range(0L)
                        .filter(Restrictions.and(Restrictions.measurement().equal(measurement)))
                        .filter(Restrictions.and(Restrictions.field().equal(field)))
                        .limit(limit);

        // async call
        queryApi.query(
                flux.toString(),
                (cancellable, record) -> System.out.println(record.getValue()),
                throwable -> System.out.println(throwable),
                () -> System.out.println("default")
        );
    }
}- 编写测试类
@SpringBootTest
class InfluxServiceTest {
    @Autowired
    private InfluxService influxService;

    @Test
    void insert() {
        influxService.insert("init", "temperature", "value", 20);
    }

    @Test
    void queryByFluxString() {
        influxService.queryByFluxString("init", "temperature", "value", 100);
    }

    @Test
    void queryByFlux() throws InterruptedException {
        influxService.queryByFlux("init", "temperature", "value", 100);
        // async call,让主线程等待一下
        Thread.sleep(3000);
    }
}
可以看到,数据已经被成功地添加了进去
更多用法可以参考官方文档: https://github.com/influxdata/influxdb-client-java/tree/master/client#influxdb-client-java
Benchmark
Inch
Inch 是 InfluxDB2 的官方性能测试工具,采用 go 语言编写,源码只有两个文件
使用以下命令把代码克隆下来,并编译
$ git clone [email protected]:influxdata/inch.git
$ cd inch
$ go build -o inch ./cmd/inch/main.go
编译完成之后就可以开始使用了
具体参数如下:
Usage of inch:
  -b int
    	Batch size (default 5000)
  -c int
    	Concurrency (default 1)
  -consistency string
    	Write consistency (default any) (default "any")
  -db string
    	Database to write to (default "stress")
  -delay duration
    	Delay between writes
  -dry
    	Dry run (maximum writer perf of inch on box)
  -f int
    	Fields per point (default 1)
  -host string
    	Host (default "http://localhost:8086")
  -m int
    	Measurements (default 1)
  -max-errors int
    	Terminate process if this many errors encountered
  -p int
    	Points per series (default 100)
  -report-host string
    	Host to send metrics
  -report-tags string
    	Comma separated k=v tags to report alongside metrics
  -shard-duration string
    	Set shard duration (default 7d)
  -t string
    	Tag cardinality (default "10,10,10")
  -target-latency duration
    	If set inch will attempt to adapt write delay to meet target
  -time duration
    	Time span to spread writes over
  -v	Verbose
执行以下命令进行性能测试
$ inch -v2 -c 8 -b 10000 -t 100,20,4 -p 100000 -v \
  -token ${token}
回到 InfluxDB UI 的 dashboard 即可查看到相关数据
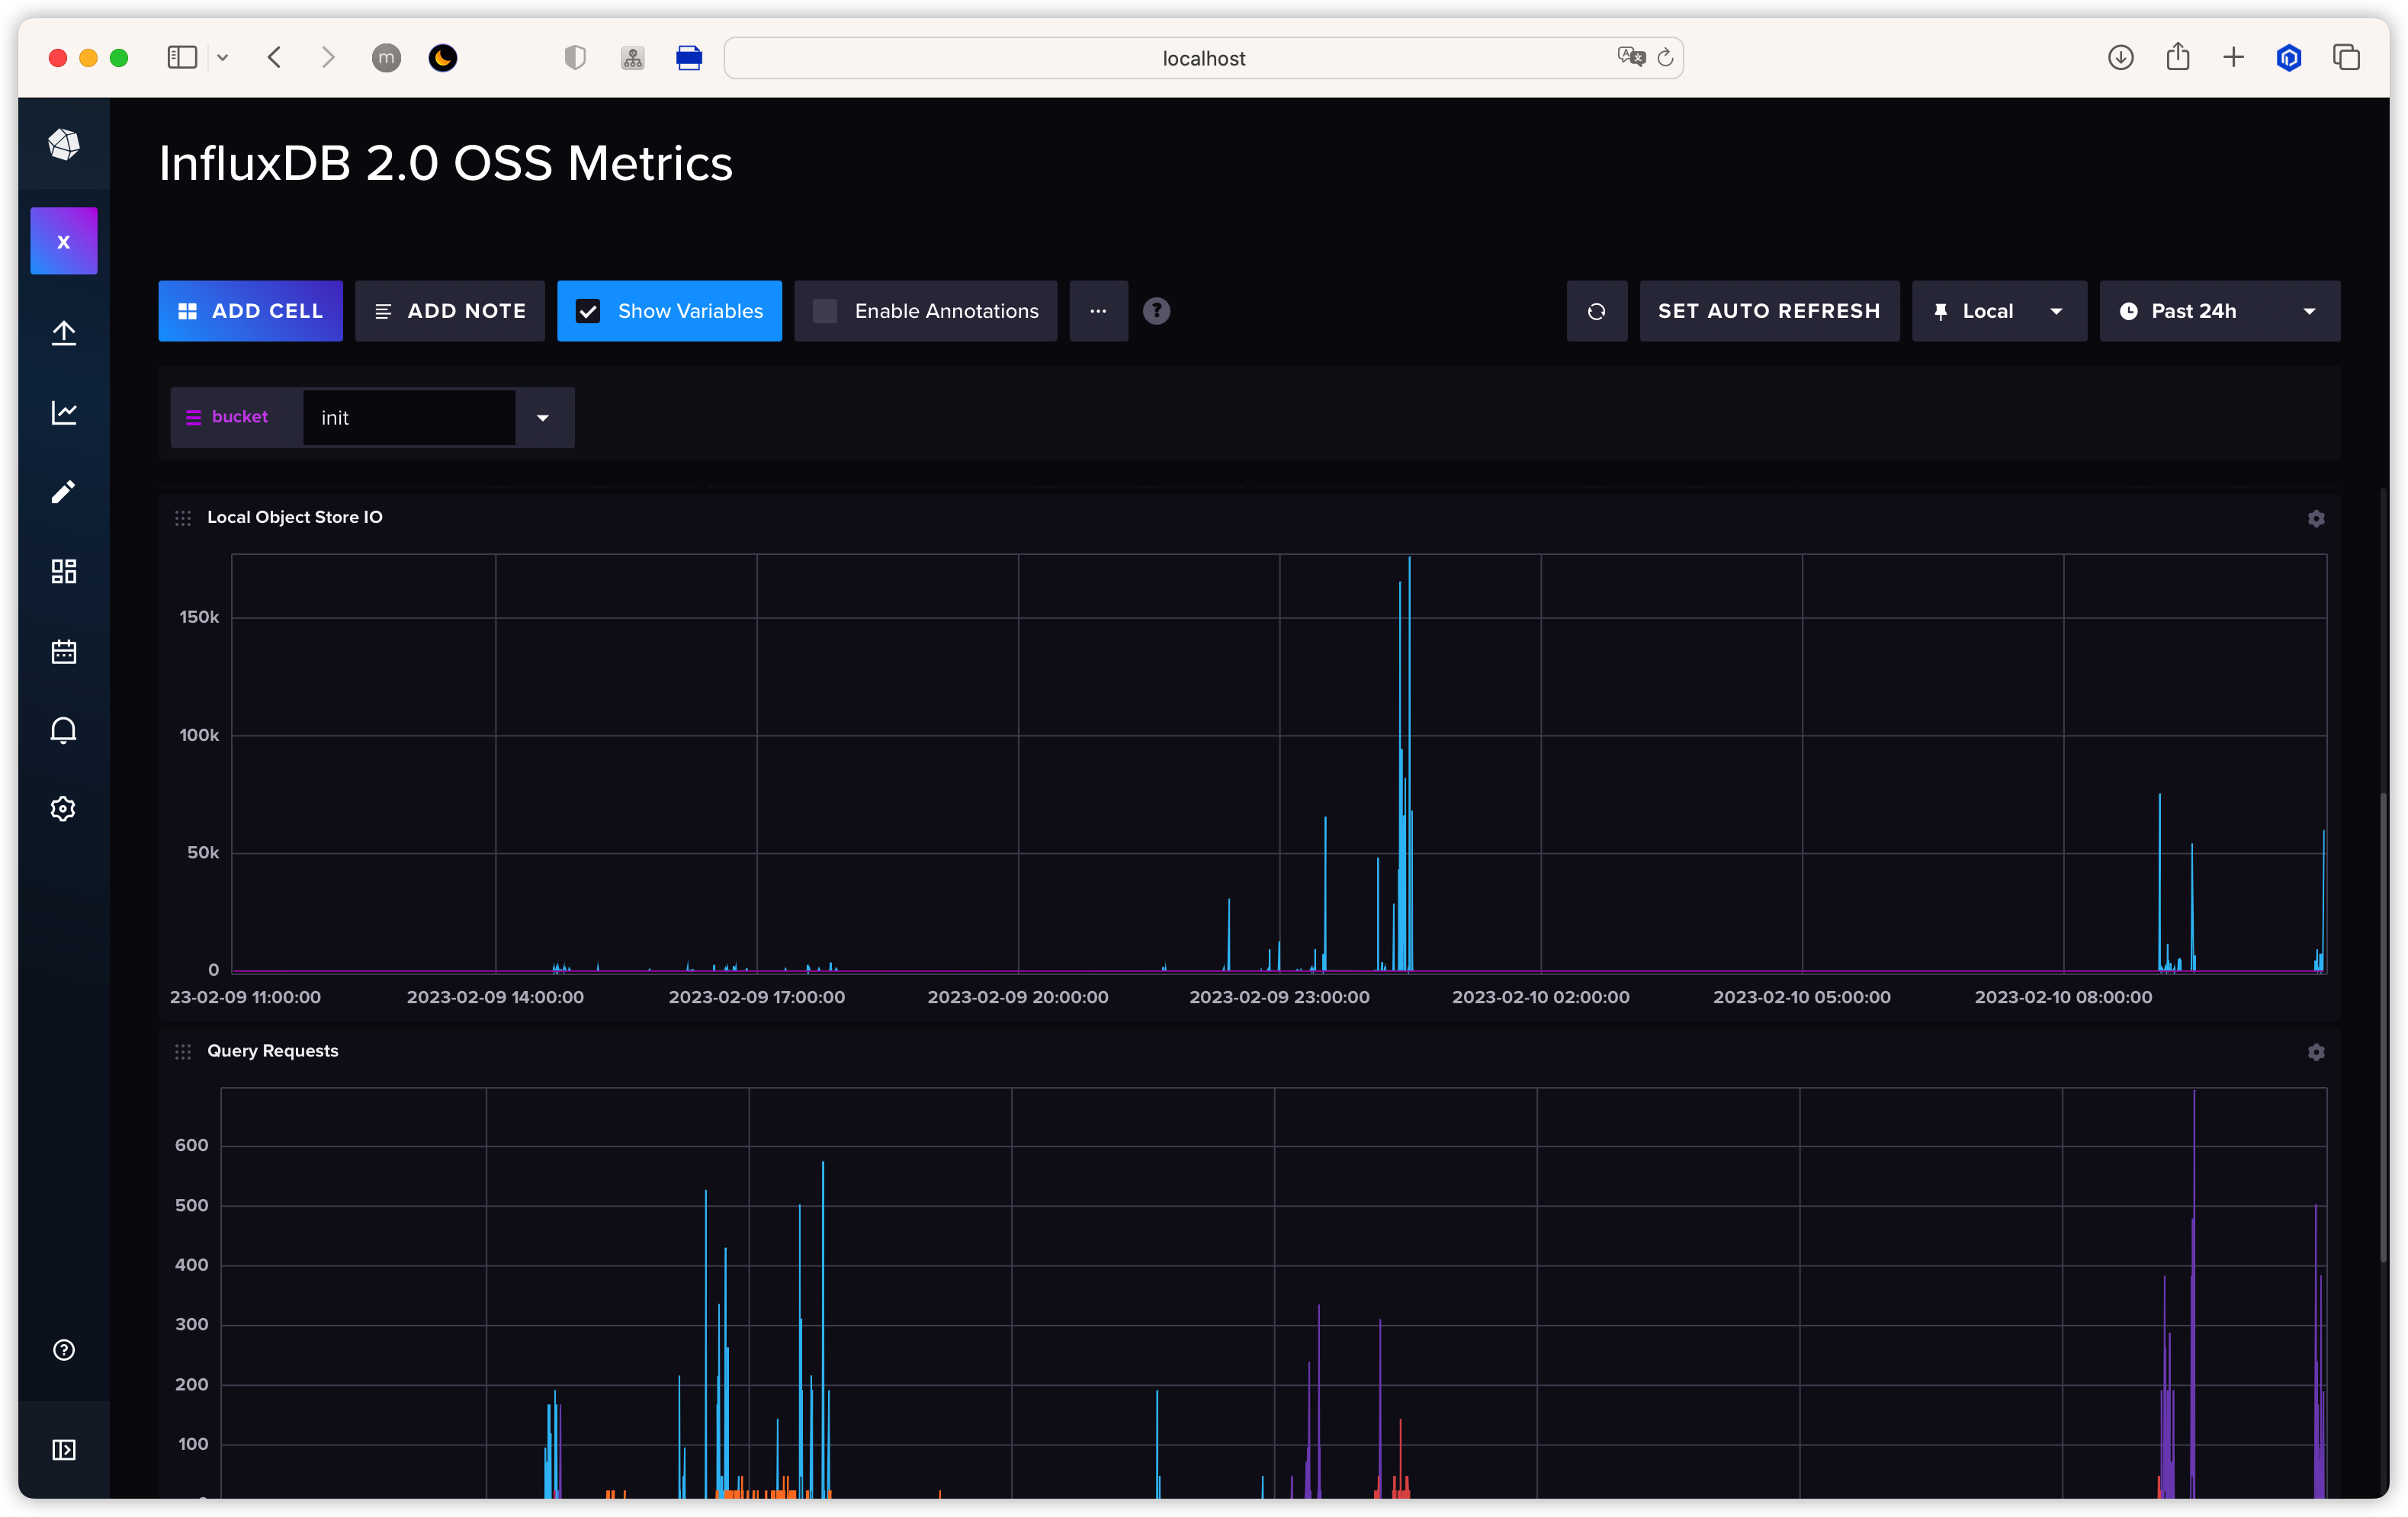
Inch Benchmark
Jmeter
除了 Inch,Jmeter 也提供了测试工具
打开 Jmeter 按照以下进行配置, 点击启动即可向 InfluxDB 发送请求,具体数据可以通过 InfluxDB UI 提供的监控进行查看
打开 Jmeter 按照以下进行配置, 点击启动即可向 InfluxDB 发送请求,具体数据可以通过 InfluxDB UI 提供的监控进行查看
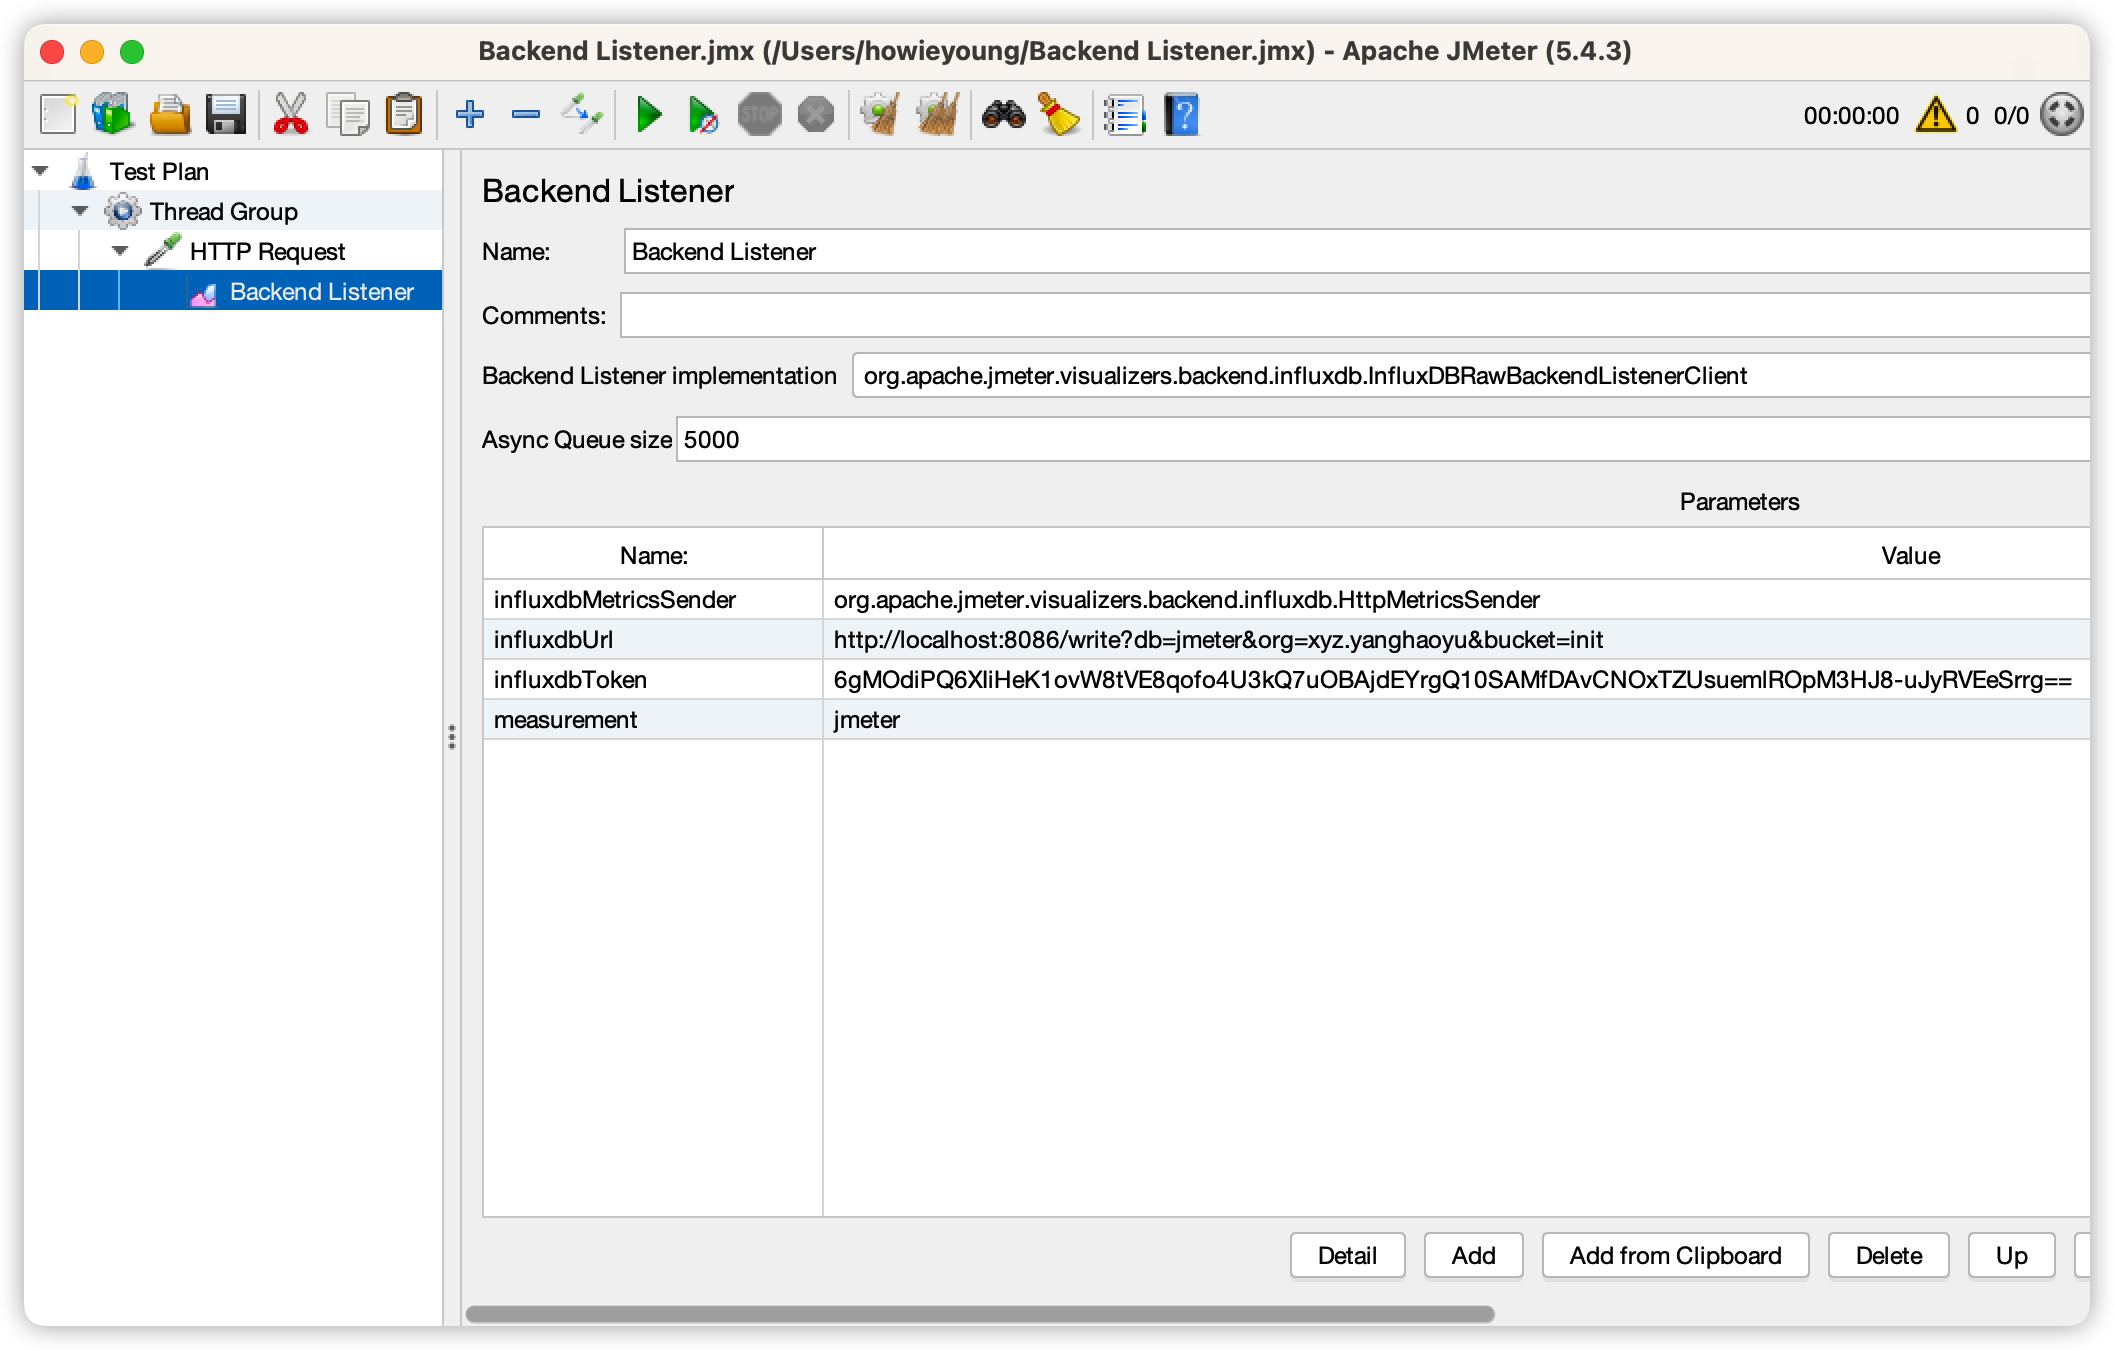
Jmeter Benchmark
Author: Howie Young Publication Date: 2/3/2023
Licensed under CC BY-NC 3.0